The common use of high-resolution tree gauges and downhole permanent pressure/temperature gauges has made it possible to use the measured pressure drop in the wellbore to directly and accurately calculate the gas rate. This is accomplished by first combining an equation of state with a dynamic heat transfer model to create a phase-thermal model (PTM). The PTM is then integrated with a direct solution to the mechanical energy balance (MEB) for flow in pipes.
The results obtained using this technique can be as accurate as, or in some cases more accurate than, conventional rate measurements. Since the wellbore may also be used for fluid density validation, the effective gas gravity (an input for many conventional flow rate calculations) may also be determined during shut-ins and used as an input to improve the accuracy of meter provers.
The purpose of this paper is to explain the physics behind the gas rate calculation and to present case study results from the implementation of this method in both real-time and historic data processing. The paper will also discuss the limitations of this method and the range of potential applications.
Click Download Now below to access the technical paper.
See the associated presentation here: https://www.odsi-energy.com/wellbore-as-a-d-p-meter-to-calculate-gas-rate-presentation
C. Fair, R. Flores, E. Montague, B. Hakim, S. Nande, V. Zhumagulova, A. Caylor and P. Draper
Oilfield Data Services, Inc.
2107 Brun Street
Houston, Texas 77019
United States of America
chris.fair@oilfielddataservices.com
ABSTRACT
The common use of high-resolution tree gauges and downhole permanent pressure/temperature gauges has made it possible to use the measured pressure drop in the wellbore to directly and accurately calculate the gas rate. This is accomplished by first combining an equation of state with a dynamic heat transfer model to create a phase-thermal model (PTM). The PTM is then integrated with a direct solution to the mechanical energy balance (MEB) for flow in pipes.
The results obtained using this technique can be as accurate as, or in some cases more accurate than, conventional rate measurements. Since the wellbore may also be used for fluid density validation, the effective gas gravity (an input for many conventional flow rate calculations) may also be determined during shut-ins and used as an input to improve the accuracy of meter provers.
The purpose of this paper is to explain the physics behind the gas rate calculation and to present case study results from the implementation of this method in both real-time and historic data processing. The paper will also discuss the limitations of this method and the range of potential applications.
KEYWORDS
Thermal modelling, rate calculation, wellbore warming, wellbore cooling, wellbore heat transfer, convection, conduction, forced convection, PVT, equation of state, parametric effects, downhole permanent gauge, wellbore d/p meter, direct gas rate calculation, gas composition, condensate and water yields, mechanical energy balance for flow in pipes, Cullender-Smith method, average compressibility method, numerical integration, calculated bottomhole pressure, continuity equation, rate allocation, phase behaviour, phase-thermal model, frictional losses, friction tuning, boundary layer disruption, subsea flowmeter, subsea multi-phase flowmeter.
INTRODUCTION
The three major components of a rigorous wellbore fluid model (aside from an accurate description of the flow path of the fluid) are:
-
- A way to accurately predict the properties of the wellbore fluid as a function of temperature and pressure (equation of state [EOS]).
- A means of calculating or predicting the temperature at any point along the wellbore as a function of flow rate, time and fluid properties (dynamic heat transfer model).
- A means of using methods 1 and 2 (above) coupled with the mechanical energy balance (MEB) to determine:
a) the pressure drop in the wellbore, given a rate; and,
b) the rate with a given pressure drop.
While flow correlations may be used for certain ranges of temperature, pressure, and fluid composition for a single point in time, to model path-dependent parametric processes, a more rigorous method must be used. The following section discusses the details of the physical phenomena that must be modelled simultaneously to calculate the pressure drop in a pipe. Then the same framework is used to calculate the gas rate from measured pressured drop.
BACKGROUND
This section explains the fundamental physics involved in modelling fluid behavior in a wellbore.
Continuity equation
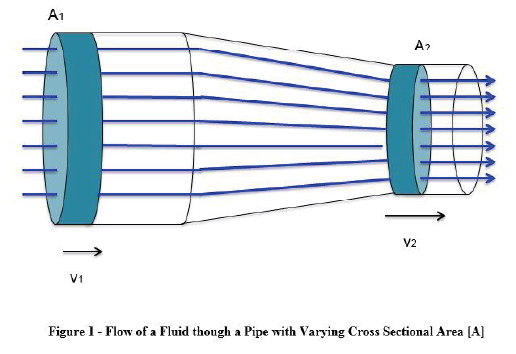
The basic theory behind the continuity equation, which is also known as the law of conservation of mass or the Zeroth law of thermodynamics, is that for a pipe (or any vessel), the volume of fluid entering the pipe per unit time should be equal to the volume of fluid leaving the pipe per unit time. Since rate is just volume per unit time, in simple terms the continuity equation indicates that the rate at which the fluid enters the pipe should be equal to the rate at which the fluid leaves the pipe. For a constant mass flow and for a short time interval the equation in cylindrical coordinates is:

The simplified form of Equation 1 (Eq. 2) assumes consistent fluid composition and neglects its compressibility.

-
- ρ is the density of the fluid (M/L3);
- A1 and A2 are the cross-sectional areas at the inlet and outlet, respectively (L2); and,
- v1 and v2 are the velocities of the fluid at the inlet and outlet, respectively (L/T).
If Equation 2 is applied to a wellbore, it follows that the volume of fluid entering the pipe must be equal to the volume of fluid leaving. This is fairly simple to visualise for a single-phase system, but things get complicated for a multi-phase flow. By means of Equation 2 the continuity inside the wellbore can be checked at each point. If continuity holds, the wellbore can be modelled with a direct solution to the Bernoulli equation. If not, the well is loading (Fair et al, 2014). Figure 1 is a visual representation of Equation 2. Use of the checkpoints shows that although the areas differ, the same volumetric flow rate applies to both points.
Peng-Robinson-Peneloux EOS
An EOS is used to define the relationship between fluid thermodynamic properties and its physical properties. The thermodynamic properties include pressure, volume and temperature, while the physical properties include density, viscosity, conductivity,
heat capacity, and liquid and gas fractions. The two most commonly used EOSs in the oil industry are the Soave-Redlich-Kwong (SRK) EOS and the Peng-Robinson EOS with Peneloux correction (Peneloux et al, 1982). In practice, the Peng-Robinson equation is more accurate in estimating the density of the reservoir fluid and will be the subject of the following discussion. Peng-Robinson originally proposed the following equation:

where


and

where

and

(Ashour et al, 2011).
In Equations 3–8 (noting the difference between a and alpha [a]):
-
- P is the absolute pressure (MPa);
- R is the ideal gas constant (8.314 J/mol-K);
- T is the absolute temperature (K);
- Vm is the molar volume, V/n (l/mol);
- ω is the component acentric factor;
- Tc is the component critical temperature (K); and,
- Pc is the component critical pressure (MPa).
Peneloux et al (1982) proposed the following constant volume shift correction:

where

Mechanical energy balance (MEB)
The first law of thermodynamics, one of the most fundamental laws of physics, asserts that energy can neither be created nor destroyed, only altered in form. This fundamental law can be applied to fluid flow through pipes, including wellbores (Morrison, 2005).
With respect to flow through pipes, the first law can be broken into frictional losses, potential energy (head), kinetic energy losses, losses at fittings/elbows, and shaft work (Ws). In this form, it is frequently called the Bernoulli equation.
For slightly compressible fluids (or for pipe increments where the compressibility changes are linear), including friction and losses at changes in the flow path, the equation becomes:
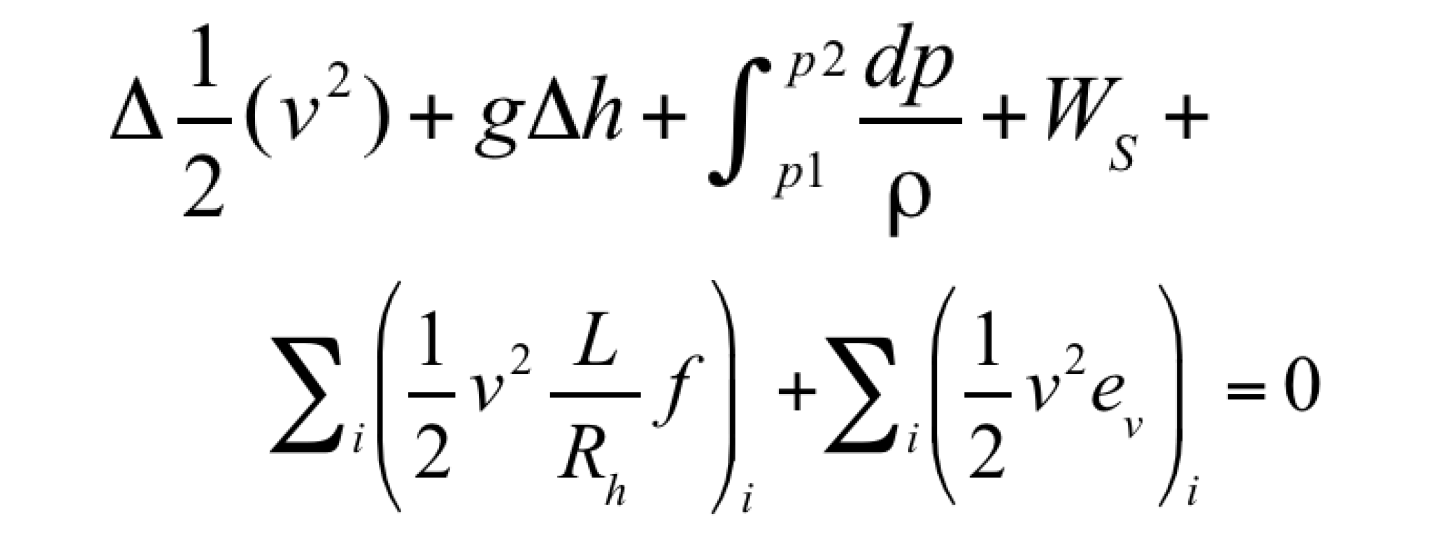
In Equation 11, the first term is kinetic energy, the second term is head (DP due to gravity), the third term is the pressure drop, the fourth term is shaft work, the fifth term is pressure loss due to friction and boundary layer disruptions, and the last term is losses due to elbows, bends, expansions and constrictions in the flow path, and in oilfield units. The variables are:
-
- v is the superficial velocity (ft/sec);
- g is the gravitational constant (32.17 ft/sec2);
- gc is the gravitational conversion constant (32.17 ft-lbm/lbf-sec2);
- h or z stands for height (ft)—true vertical depth/height;
- p is pressure (psia);
- ρ is density (lbm/ft3);
- Ws is shaft work (horsepower or ft-lbf/sec)—usually supplied by a pump;
- L is the pipe length (ft)—measured depth;
- Rh is the hydraulic radius (ft);
- f or ff stands for friction factor (dimensionless);
- ev is the friction loss factor (dimensionless); and,
- D is the pipe diameter (ft).
For predominantly gas-phase natural flow, neglecting insignificant terms (i.e. everything except friction and head), Equation 11 reduces to:

In Equation 11, θ represents the angle formed by the intersection of measured depth and the horizon (the gravity term is relative to true vertical depth; friction is relative to total pipe length—measured depth).
Boundary layers in pipes
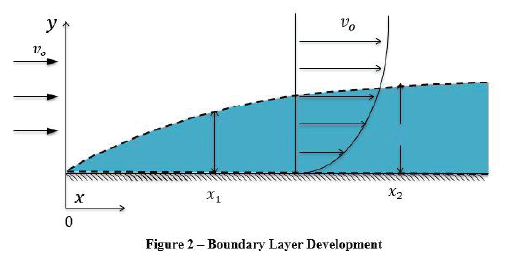
When a fluid flows over a stationary surface like a pipe wall, the near-wall fluid is brought to rest by the shear stress at the wall. Away from the wall, the velocity increases from the wall to a maximum in the main stream of the flow. The region between the wall and the point perpendicular to the pipe wall where the velocity profile is no longer affected by the shear stress is called the boundary layer. Figure 2 shows the development of a boundary
layer near a flat plate of negligible thickness. The fluid approaches with uniform velocity, vo. Velocity away from the wall is a function of the distance, y. Frictional losses occur in the boundary layer. After much simplification, Equation 13 is derived in literature (Bird et al, 1960):

This equation is to be solved using the following boundary
conditions:
• vx = 0 at y = 0;
• vx = v∞ at y = ∞; and,
• vx = v∞ at x = 0 for all y.
The Fanning friction factor (Bird et al, 1960) is an attempt to account for the pressure losses due to friction in the boundary layer. If there are no boundary layer disruptions, it is accurate. Due to non-ideal connections, especially those with pipe dope extruding into the flow path, however, the boundary layer gets disrupted. This causes additional frictional losses.
Friction and boundary layer disruption
It is crucial to understand the effect of boundary layer disruption on overall pressure drop due to friction. Friction between the fluid and the pipe occurs in the boundary layer. Usually pipe friction is accounted for by the Reynold’s number and pipe roughness factor provided by the manufacturer. In reality, however, the boundary layer gets disrupted when there are changes in material and/or effective IDs (inner diameters) resulting in additional frictional pressure loss. This causes friction calculations that depend only on the pipe roughness factor to underestimate the frictional losses as a function of rate.
Despite the fact that the effect of boundary layer disruptions increases the frictional losses, it is still possible to use the Fanning friction factor concept. To do so, a pressure drop calibration is required under constant fluid composition flowing conditions with one or multiple pressure measurements on/in the wellbore. A preferred method of doing so is a multi-rate test. Essentially, in a multi-rate test, the sources of frictional pressure drop remain the same. By measuring/calculating pressure drop along the wellbore during the tests at different rates, the effective friction factor can be back-calculated either directly or
iteratively, as long as the density components of pressure drop are accurately accounted for. This process is addressed in more detail in the 3-Rate section of this paper.
Modelling heat transfer—wellbore warming and cooling through conduction, convection and forced convection
As warm fluid enters the wellbore from the reservoir and flows to the surface during production, heat is transferred from the fluid to the wellbore, casing, cement and surrounding formations. In the case of injection, the fluid may be warmer or cooler, and heat may be transferred from fluids to the surroundings and vice versa (US Department of Energy, 1992). When the well is shut-in, fluid in the wellbore will asymptotically approach the geothermal gradient of the surrounding formations.
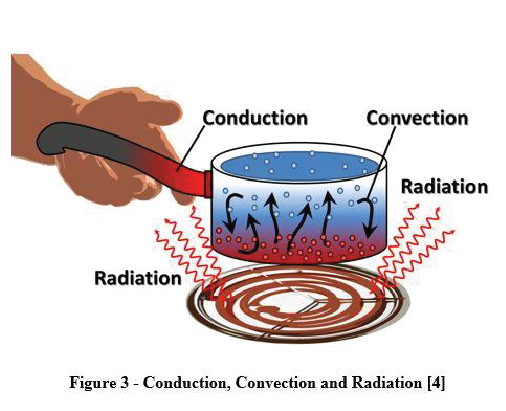
There are four different modes of heat transfer in the wellbore. Heat transfer occurs by conduction, free/natural convection, forced convection and, to a much lesser extent, radiation. All four modes occur through the fluid media, the pipe walls, the annular fluids/solids, et cetera, to or from the surrounding formations. For the sake of this discussion, flow behind pipe will not be considered.
Conduction is a mode of heat transfer by the vibration of molecules/ particles within the materials or materials in direct contact. Because heat is transferred from high to low vibration zones, it is transferred from higher temperature to lower temperature.
Conduction is the dominant manner of heat transfer in solids and is important in liquids and gases. A good example of conduction is holding a hot cup of coffee: heat transfers from the coffee to the cup, and then from the cup to the palm by conduction.
Convection is a mode of heat transfer in liquids and gases. It occurs through movement of molecules within the fluid. There are two categories of convective heat transfer: free—also known as natural—convection, and forced convection. In natural convection, heat transfer takes place as the temperature affects the density. As density changes, so to does the buoyancy, creating bulk fluid motions. A good example is steam evolving from a pot of boiling water, as shown in Figure 3. The density is constantly changing, and that affects bulk fluid motion. The variations in fluid density occur due to changes in temperature and/or composition within the fluid.
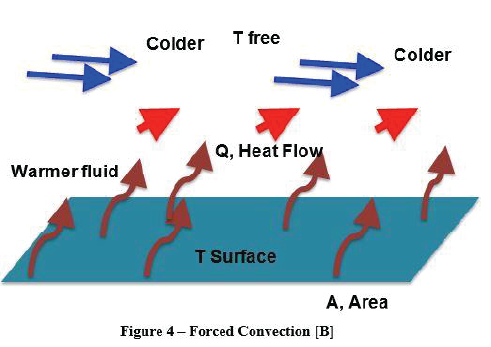
Forced convection is the third mode of heat transfer and is visually described in Figure 4. Fluid flow is induced by external forces such as fans, turbines, blowers or a flowing wellbore. For onshore wells, the effects of ambient temperature and wind can also play a role in heat transfer. For offshore wells, conduction and forced convection to/from the water (and the water currents) also plays a major part in heat transfer.
Radiation is the only mode of heat transfer without a medium. Thermal conduction and convection are more important in heat transfer, so the effect of radiation can be ignored unless the annulus size increases and the materials have high emissivity.
Thermal convection can be calculated using Equation 14.

-
- Q represents energy transferred as heat;
- h is the convection coefficient;
- A is the surface area;
- Tsurface is the temperature at surface; and,
- Tfree is the temperature in free stream.
Ambient effects
Heat transfer is also influenced by ambient effects like temperature and wind for onshore wells. A good example is produced hot fluids losing heat to very cold surroundings during winter, or the scorching sun warming up the fluids at the wellhead. For offshore wells, conduction and forced convection to/from the water are of importance as well (conduction: produced fluids losing heat to the cool sea water by a riser; forced convection: wind and water currents drawing out heat from riser constantly). The heat loading from other wells also must be considered.
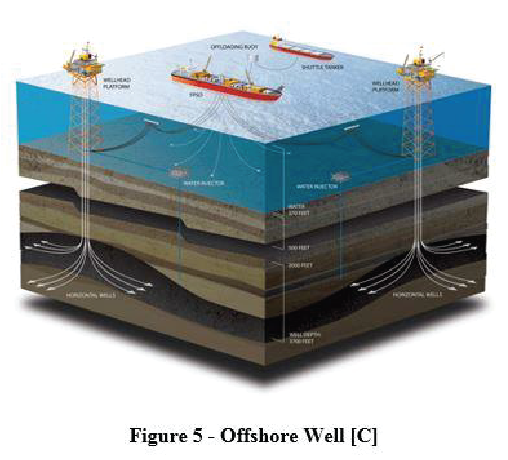
Figure 5 shows a schematic of an offshore field. The wells penetrate the reservoir rock containing hydrocarbons. Hydrocarbons enter the wellbore through perforations and flow up to the surface platform. Heat is lost from the fluids to the surrounding rock, water and air at different rates due to different temperature gradients through conduction and forced convection. Fortunately, all four heat transfer phenomena can be modelled, and results can be calculated or adequately approximated. As discussed before, the boundary layer distribution is a complex phenomenon. The compressible and non-isothermal nature of flow makes things even more difficult to model. The easiest way, however, to account for all the heat transfer mechanisms is to create a series of equations for each of the individual mechanisms and components. This series of equations can be used to generate an overall heat transfer coefficient equation. The equation can then be tuned with real well temperature data to improve the accuracy. This is normally done by conducting
a 3-rate test.
3-Rate (or more) test
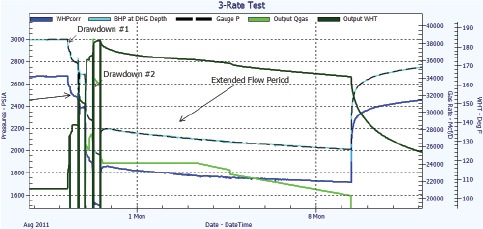
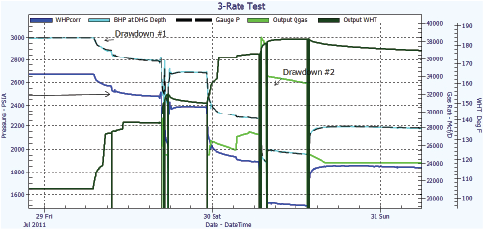
Once the EOS for the fluid has been built and tuned with a static pressure survey, the flowing data can be simultaneously tuned for the thermal profile and friction. The process involves creating a solution matrix for the various components of heat transfer and an initial estimate for the friction factor. The thermal profile of the wellbore can then be generated as a function of rate and time. At points in time where the calculated downhole gauge (DHG) temperature and measured DHG temperature match, the frictional component of the wellbore can then be tuned to the measured rate. The thermal model can then be fine-tuned to ensure that the wellhead pressures converted to DHG depth pressures are equal to the measured downhole pressures for the history of the data set (as long as the measured or modelled rates are valid).
Figures 6 and 7 demonstrate the results of this process. The end result is a tuned dynamic model for heat transfer and a calibrated friction factor. Note that the bottom hole pressure (BHP) at DHG depth and the gauge pressure overlay except at places where the rate is not valid.
Once this process has been completed, the Bernoulli equation (MEB) can be re-arranged and solved for gas rate using the difference between the gauges as the controlling factor. It is also important to note that the measured temperatures at the surface must be corrected for ambient losses to the centerline of the pipe. If the temperature is measured in a thermocouple, it can be used for flowing conditions, but cannot be used for shut-in conditions.
The equation for calculating the gas rate (derived from Eq. 12 by substituting for velocity and density) is:

-
- Z is the gas compressibility factor;
- R is the ideal gas constant (10.732 ft3-psi/R-lb-mole);
- T is the absolute temperature (R);
- MWgas is the molecular weight of gas (g/mol, lbm/lb-mole);
- P is the absolute pressure (psia);
- g is the gravitational constant (32.17 ft/sec2);
- θ represents the angle formed by the intersection of measured depth and the horizon (gravity term is relative to true vertical depth; friction is relative to total pipe length— measured depth);
- f or ff represent the friction factor (dimensionless);
- gc is the gravitational conversion constant (32.17 ft-lbm/lbf- sec2);
- Tsc is the temperature at standard conditions (R);
- Psc is the pressure at standard conditions (psia);
- Q is the volumetric flow rate (Mscf/D); and,
- L is the pipe length (measured depth; ft).
Equation 15 is most accurately solved by numerical integration.
It can also be solved using the average compressibility or Cullender- Smith methods, as long as they account for thermal transient behavior and as long as the segment length is of sufficiently small distance to avoid error in the fluid property calculations.
CASE STUDY 1
The following case study is from a subsea dry gas well in the North Sea, equipped with high-resolution tree and downhole gauges. Multiple wells were to produce to the same host facility. In this example the initial data, where only Well 1 was producing, is considered. This allowed for a direct comparison of the platform measured gas rates versus the d/p wellbore calculatedgas rates.
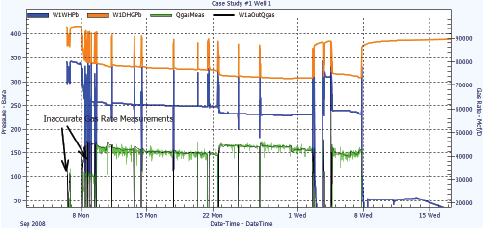
After tuning the gas composition using the difference between the downhole gauge and subsea tree measurements, the friction was tuned by selecting several points, where the well was flowing in a stable fashion. The dynamic thermal model for the well was also generated using the same reference data. The rates were then calculated using Equation 15. The results are presented in Figure 8.
It should be noted that there are times when the physical rate measurement is not accurate. This is due to loss of communication with the meter and due to inappropriate calibration of the meter calculations.
During the course of this trial, it was noted that there was significant benefit of running both calculations (the platform measured rate and the rate from the wellbore DP). The drawback to the DP-wellbore calculation was that if communication was lost to the well or to one of the pressure sensors, it would not be possible to calculate the gas rate using the DP-wellbore method. Fortunately, if communications were restored and the data was
still saved at the host facility, the data could still be processed. Another drawback was that if the well had started to produce water, there would have been no way to identify the production of water from the DP flow rate calculation alone. When the well began making water later in its life, however, the start of water production could be determined by looking for differences in simultaneous rate calculations from different methods. The water production could then be allocated by modelling the additional water rate that was required to match the deviation.
CASE STUDY 2
The following case study is also from a subsea field in the North Sea. Two wells were completed and tied-back to the host facility where the combined rates from both wells were measured. The operator, already having enough confidence based on previous experience with the wellbore DP gas rate calculations, did not feel the need to spend several million Euros to purchase and install subsea flowmeters.
The initial tuning of the density portion of the EOS was performed using the results of the build-up following the flowback/ initial completion test of the wells and the compositional analysis of the fluid samples. The wellbore pressure losses during the flow tests were also used to provide an initial friction factor. The wells, however, were not fully cleaned-up, so it was expected that further tuning would be required to calculate the gas rates accurately. An initial thermal model was also generated, with the same caveats as the friction calculations. A further complication was that one of the wells was producing from two different intervals, one of which had a slightly higher condensate yield than the other.
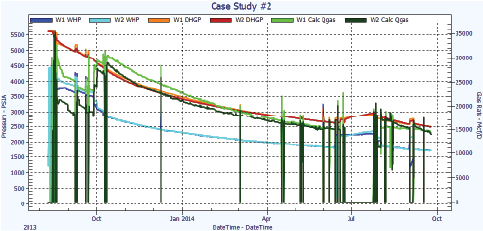
The first well was brought on-line and flowed at several different rates until clean-up was confirmed. It was then shut-in while the same procedure was followed with the other well. Tuning of the well models was conducted live to match the measured platform rates. Then, both wells were brought online together and the sum of the calculated wellbore DP rates was then compared to the rate measured at the host platform. Figure 9 shows the wellhead and downhole pressures, as well as the rates calculated for the individual wells. Figure 10 presents the results of the sum of the rate calculations and the rates measured at the host platform.
The initial matches of the calculated versus measured rates were extremely close. When the wells were ramped-up in early October 2013, the calculated rates were slightly lower than the measured gas rates (a difference of about 1.5%). The difference between the methods gradually decreased until the values matched again from January–April 2014. Afterwards, the calculated gas rates were slightly higher than the measured rates at the platform (less than 1% difference).
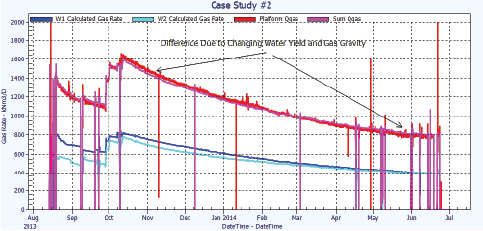
The reason for these differences became clear once the wells were shut-in in June 2014. Well 2 had a leaner gas composition than had been measured/tuned in the initial testing. This would cause the calculated rate to be lower than the actual rate, as some of the pressure drop would be attributed to head of a slightly heavier fluid with a richer composition. In addition, Well 1 began producing slightly more water than initially measured, causing more apparent friction and resulting in a higher rate calculation. These effects balanced out overall, and no issues were even noticed until shortly before the submission of this article. Ways to detect small increases in water production with time are being researched, but for now the solution is to manually adjust the water rates based on the heat loading in the well. A solution has already been prepared for changing gas compositions: auto-tune the EOS density during shut-ins. Note: there were no shut-ins of sufficient duration prior to June 2014.
This case study demonstrated the benefit of individual rate allocations based on both conventional platform measurements and the direct wellbore DP calculation. It also points out some of the potential drawbacks to the wellbore DP rate calculation—both relating to the composition of the fluid in the wellbore and the dependence on the density portion of the EOS to separate the head from the friction. By understanding how the various flow meters and flow calculations work, discrepancies can be noted and the cause can be tracked down and corrected.
CONCLUSIONS
The delta pressure between high-quality gauges in or on a well can be used to calculate the gas rate. This is done by solving the Bernoulli equation (mechanical energy balance [MEB]) for rate by numerical integration. Solving the MEB, however, is just part of the process. To get accurate rate calculations, it is necessary to have parametric/dynamic functions for heat transfer in the well (and near the well), combined with a calibrated equation of state and a tuned frictional model. The accuracy of this technique has been demonstrated during field trials and during commercial operations. Even if direct rate measurements are used, having a back-up calculation can greatly assist in diagnosing errors in allocations and can detect the onset of water production and/or a change in the gas composition. In addition, if the flow meter fails, the DP wellbore calculations can be used on its own to determine the rate.
Finally, since this is a passive technology, it does not require any additional equipment to be installed. If the well is already instrumented with tree and downhole gauges, the gas rate calculations can be performed in real-time and on historic data, making this a low-cost investment to more accurately understand production rate and allocations.
REFERENCES
ABBEY, T., 2014—How to use FEA for thermal analysis. Accessed
February 2014. <http://www.deskeng.com/de/use-feathermal-
analysis/>.
ASHOUR, I., AL-RAWAHI, N., FATEMI, A. AND VAKILI-NEZHAAD,
G., 2011—Application of EOS in the oil and gas industry.
In: Moreno-Piraján, J.C. (ed.) Thermodynamics – Kinetics
of Dynamics Systems. Rijeka, Croatia: InTech.
BRADBURY, J., 2010—Bentley brings good news. Accessed
January 2014. <http://www.offshore.no/international/news/
article.aspx?id=17735>.
BIRD, R., STEWART, W. AND LIGHTFOOT, E., 1960—Transport
phenomena. New York: John Wiley & Sons.
DVAPPHYSICS, 2015—Fluids in motion. Accessed February
2015. <http://dvapphysics.wikispaces.com/Fluids+in+Motion>.
FAIR, C., FLORES, R., HAKIM, B. AND NANDE, S., 2014—Using
Results from Automated Petroleum Engineering Calculations
to Accelerate Decision Workflows. SPE Asia Pacific Oil and Gas
Conference and Exhibition, Adelaide, South Australia, 14–16
October, SPE 171512.
LAMBERT, J. AND EDWARDS, A., 2013—Energy: the driver
of climate—temperature and radiation. Accessed January
2014. <http://www.ces.fau.edu/nasa/module-2/correlationbetween-
temperature-and-radiation.php>.
MORRISON, F.A., 2005—Mechanical energy balance: intro and
overview. Published 9 June 2005. Houghton, Michigan: Michigan
Technological University.
PENELOUX, A., RAUZY, E. AND FREZE, R., 1982—A consistent
correction of Redlich-Kwong-Soave volumes. Fluid Phase
Equilibria, 8 (1), 7–23.
US DEPARTMENT OF ENERGY, 1992—Thermodynamics, heat
transfer, and fluid flow. DOE Fundamentals Handbook, volume
1. Washington, D.C.: US Department of Energy.

